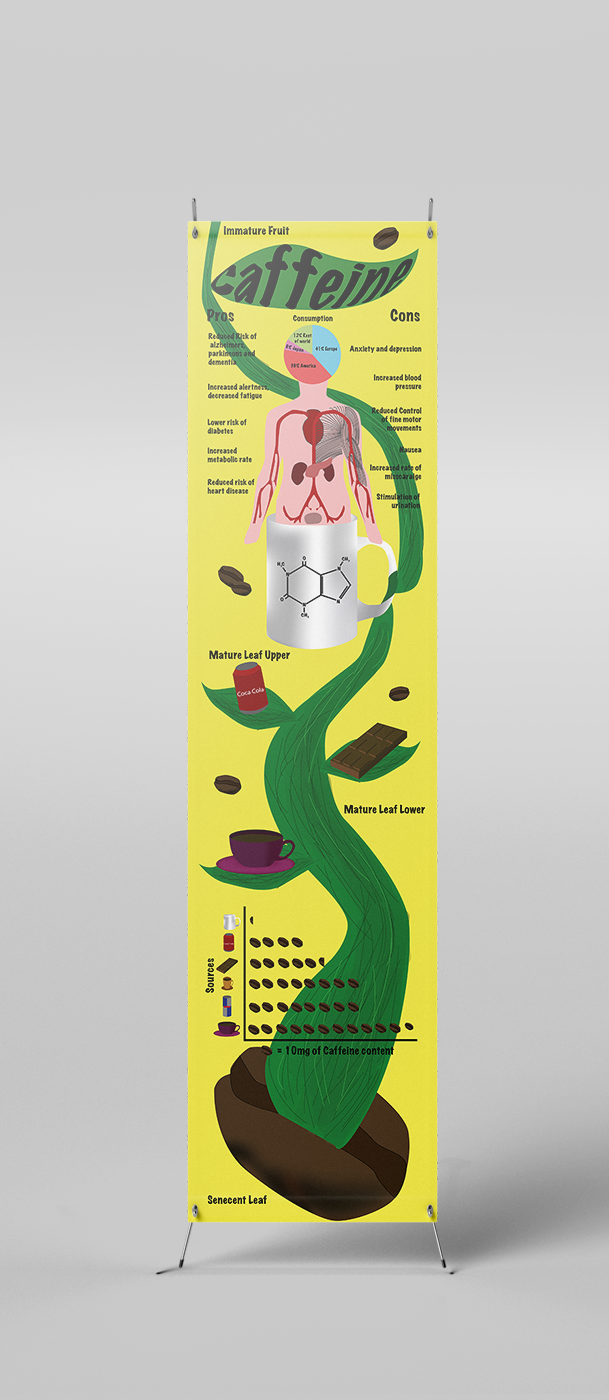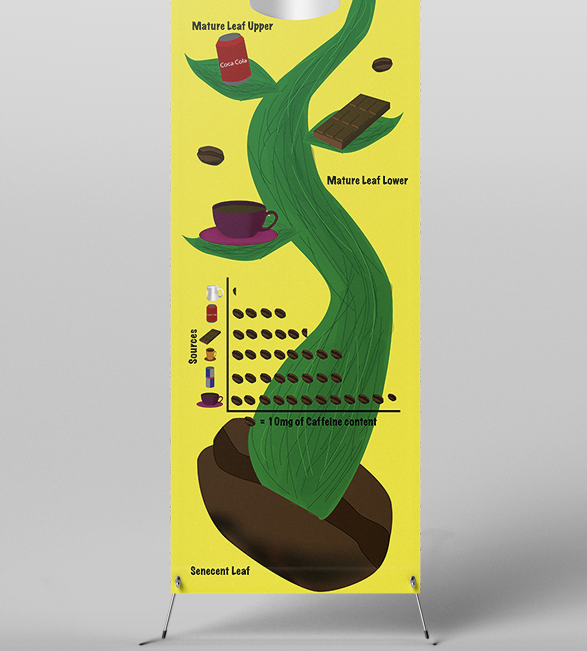
This is my infographic which I created to inform viewers visually the effects caffeine has on the body, physically and mentally. I created a visual of a body with pros and cons of caffeine around it to show what happens when it is consumed. I created a pie chart in the head to show where around in the world it has the most consumption of caffeine. The plant shows which part of a caffeine plant has the strongest amount in it and also shows a pictogram graph to show how much caffeine is in different sources such as coffees and chocolate bars.